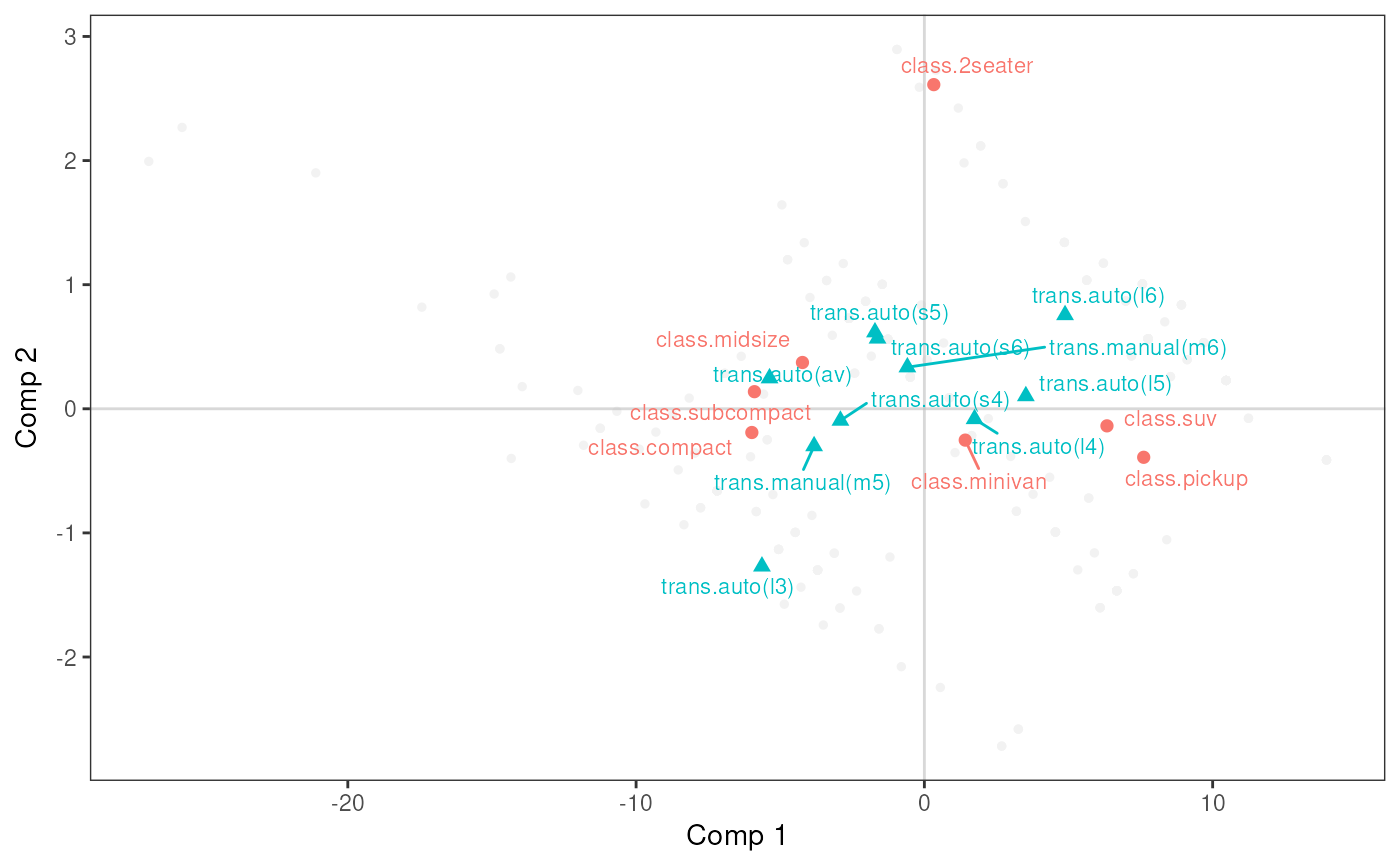
Plot of Supplementary Variables
plo_sup.RdPlots the categories of supplementary variables for a PLS regression.
plo_sup(object, vars, excl = NULL, comps = c(1,2),
 shapesize = 2, textsize = 3, vlab = TRUE, force = 1,
 max.overlaps = Inf, dashes = TRUE)
Arguments
- object
an object of class
mvrfromplspackage- vars
A data frame of categorical supplementary variables. All these variables should be factors.
- excl
character vector of supplementary categories to exclude from the plot, specified in the form "namevariable.namecategory" (for instance "Gender.Men"). If NULL (default), all the supplementary categories are plotted.
- comps
the components to use. Default is
c(1,2).- shapesize
Size of the shapes. Default is 2.
- textsize
Size of the labels of categories. Default is 3.
- vlab
Logical. If TRUE (default), the variable name is added as a prefix for the labels of the categories.
- force
Force of repulsion between overlapping text labels. Defaults to 1. If 0, labels are not repelled at all.
- max.overlaps
Exclude text labels that overlap too many things. Defaults to Inf, which means no labels are excluded.
- dashes
Logical. Should one add lines between categories ? Default is TRUE.
Value
a ggplot2 object
References
Martens, H., Næs, T. (1989) Multivariate calibration. Chichester: Wiley.
Tenenhaus, M. (1998) La Regression PLS. Theorie et Pratique. Editions TECHNIP, Paris.