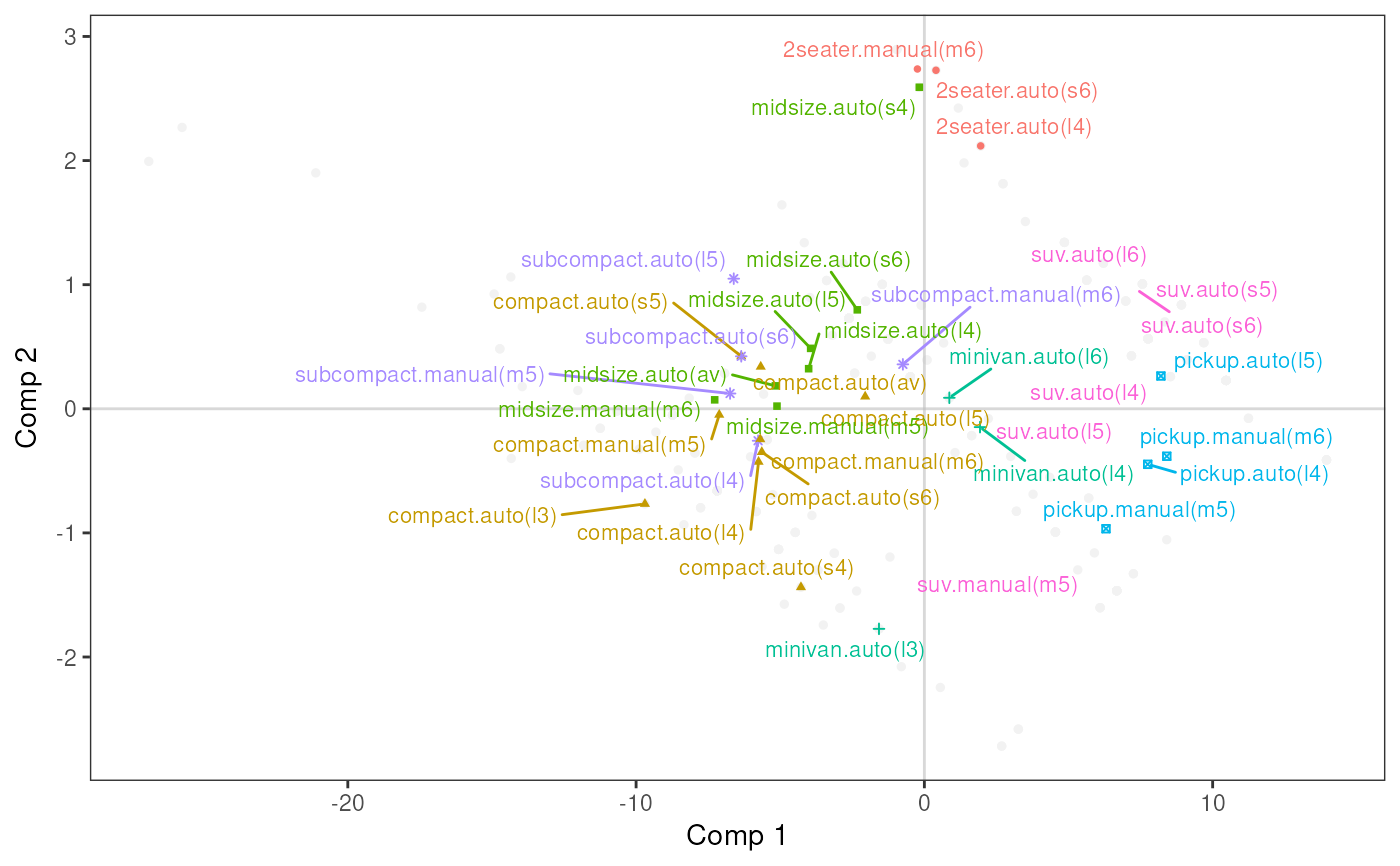
Plot of Interactions
plo_inter.RdPlots the interaction between two categorical supplementary variables for a PLS regression.
plo_inter(object, var1, var2, excl1 = NULL, excl2 = NULL,
  comps = c(1,2), shapesize = 1, textsize = 3,
  force = 1, max.overlaps = Inf,
  lines = TRUE, dashes = TRUE)
Arguments
- object
an object of class
mvrfromplspackage- var1
factor. The first categorical supplementary variable.
- var2
factor. The second categorical supplementary variable.
- excl1
character vector of categories from the var1 to exclude from the plot. If NULL (default), all the supplementary categories are plotted.
- excl2
character vector of categories from the var2 to exclude from the plot. If NULL (default), all the supplementary categories are plotted.
- comps
the components to use. Default is
c(1,2).- shapesize
Size of the shapes. Default is 1.
- textsize
Size of the labels of categories. Default is 3.
- force
Force of repulsion between overlapping text labels. Defaults to 1. If 0, labels are not repelled at all.
- max.overlaps
Exclude text labels that overlap too many things. Defaults to Inf, which means no labels are excluded.
- lines
logical. Whether to add colored lines between the points of the categories of v1. Default is TRUE.
- dashes
logical. Whether to add gray dashed lines between the points of the categories of v2. Default is TRUE.
Value
a ggplot2 object
References
Martens, H., Næs, T. (1989) Multivariate calibration. Chichester: Wiley.
Tenenhaus, M. (1998) La Regression PLS. Theorie et Pratique. Editions TECHNIP, Paris.
Examples
library(pls)
data(mpg, package = "ggplot2")
pls <- mvr(displ ~ cty + hwy + cyl,
           ncomp = 3,
           data = mpg,
           validation = "CV",
           method = "oscorespls")
supvars <- data.frame(class = factor(mpg$class), trans = factor(mpg$trans))
plo_inter(pls, factor(mpg$class), factor(mpg$trans), lines = FALSE, dashes = FALSE)
#> Warning: The shape palette can deal with a maximum of 6 discrete values because more
#> than 6 becomes difficult to discriminate
#> ℹ you have requested 7 values. Consider specifying shapes manually if you need
#>   that many of them.
#> Warning: Removed 6 rows containing missing values or values outside the scale range
#> (`geom_point()`).