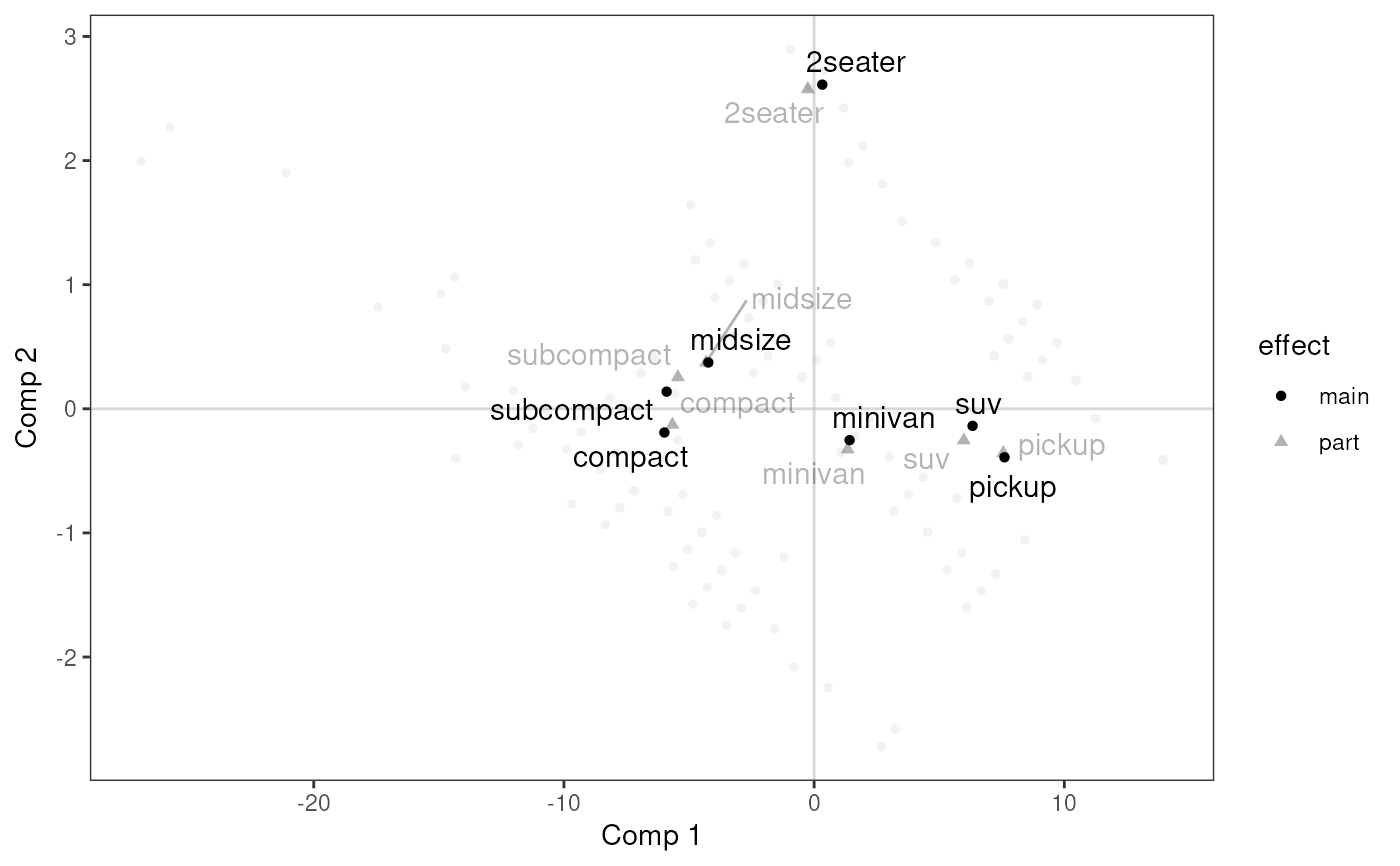
Plot of Main and Partial Effect
plo_part.RdPlots the the main and partial effects of a supplementary variable for a PLS regression, with one or more supplementary partialled out.
plo_part(object, var, controls, excl = NULL,
  comps = c(1,2), shapesize = 1.5, col = "black",
  textsize = 4, force = 1, max.overlaps = Inf,
  lines = TRUE, dashes = TRUE, alpha = 0.3, legend = "right")
Arguments
- object
an object of class
mvrfromplspackage- var
factor. The categorical supplementary variable.
- controls
data frame of supplementary variables to be partialled out (i.e. control variables)
- excl
character vector of categories from the var to exclude from the plot. If NULL (default), all the supplementary categories are plotted.
- comps
the components to use. Default is
c(1,2).- shapesize
Size of the shapes. Default is 1.5.
- col
the color for the labels and lines. Default is "black".
- textsize
Size of the labels of categories. Default is 4.
- force
Force of repulsion between overlapping text labels. Defaults to 1. If 0, labels are not repelled at all.
- max.overlaps
Exclude text labels that overlap too many things. Defaults to Inf, which means no labels are excluded.
- lines
logical. Whether to add colored lines between the points of the categories of v1. Default is TRUE.
- dashes
logical. Whether to add gray dashed lines between the points of the categories of v2. Default is TRUE.
- alpha
Numerical value. Transparency of the partial effects. Default is 0.3.
- legend
the position of legends ("none", "left", "right", "bottom", "top", or two-element numeric vector). Default is right.
Value
a ggplot2 object
Note
The partial effects of the supplementary variable are computed with the Average Marginal Effects of a linear regression, with individual coordinates as dependent variable, and the supplementary and control variables as independent variables.
References
Martens, H., Næs, T. (1989) Multivariate calibration. Chichester: Wiley.
Tenenhaus, M. (1998) La Regression PLS. Theorie et Pratique. Editions TECHNIP, Paris.